Modules: 1.1 | 1.2 | 1.3 | 1.4 | 1.5 | 1.6 | 1.7
Introduction
Electrophoresis is a technique that separates large molecules by size using an applied electrical field and a sieving matrix. DNA, RNA and proteins are the molecules most often studied with this technique; agarose and acrylamide gels are the two most common sieves. The molecules to be separated enter the matrix through a well at one end and are pulled through the matrix when a current is applied across it. The larger molecules get entwined in the matrix and retarded; the smaller molecules wind through the matrix more easily and travel further from the well. Molecules of the same size and charge migrate the same distance from the well and collect into a band.
DNA and RNA are negatively charged molecules due to their phosphate backbone, and they naturally travel toward the positive charge at the far end of the gel. They are typically examined with agarose gels. Proteins are composed of amino acids that can be positively, negatively or uncharged. To give proteins a uniformly negative charge, they are coated with a detergent, SDS, prior to running them on a gel. Protein samples are also boiled to remove any secondary structure that might make two molecules of the same size migrate differently. Polyacrylamide is the matrix commonly used to separate proteins. These gels are typically run vertically while agarose gels are run horizontally but gravity has nothing to do with the separation.
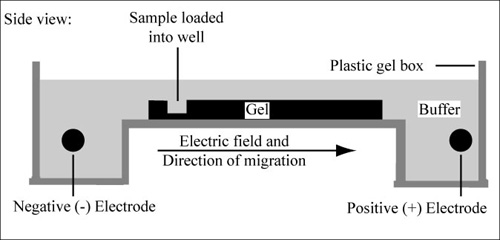
Diagram of agarose gel setup, for agarose gel electrophoresis. (Figure by MIT OpenCourseWare.)
Today you will separate DNA fragments using an agarose matrix. Agarose is a polymer that comes from seaweed and if you’ve ever made Jell-O™, then you already have all the skills for pouring an agarose gel. To prepare these gels, agarose and buffer are microwaved until the agarose is melted. The molten agar is then poured into a horizontal casting tray, and a comb is added. Once the agar has solidified, the comb is removed, leaving wells into which the DNA sample can be loaded.
The distance a DNA fragment travels is inversely proportional to its length. Over time fragments of similar length accumulate into “bands” in the gel. Higher concentrations of agarose can be used to resolve smaller DNA fragments. This figure shows the same DNA fragments resolved with three agarose concentrations. The 1000 base pair fragment is indicated in each.
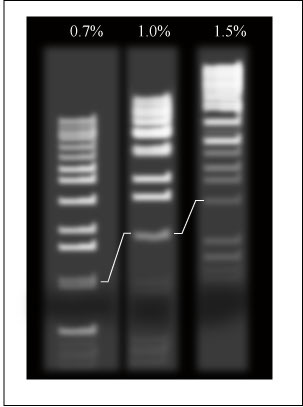
DNA fragments resolved with three agarose concentrations. The line indicates the 1000 base pair fragment. (Figure by MIT OpenCourseWare.)
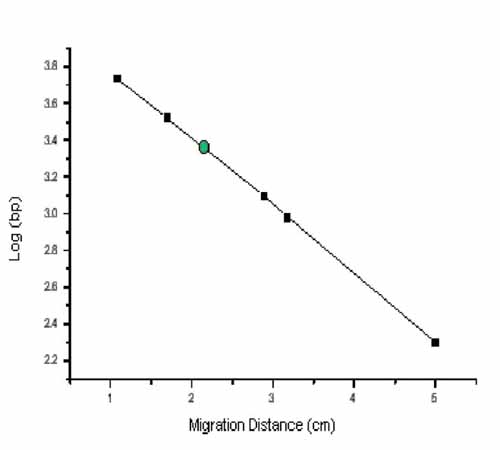
Size vs. migration distance.
Ethidium Bromide is a fluorescent dye that is commonly added to agarose gels. This dye intercalates between the bases of DNA, allowing DNA fragments to be located in the gel under UV light and photographed. The intensity of the band reflects the concentration of molecules that size, although there are upper and lower limits to the sensitivity of dyes. Because of its interaction with DNA, ethidium bromide is a powerful mutagen and will interact with the DNA in your body just as it does with any DNA on a gel. You should always handle all gels and gel equipment with gloves. Agarose gels with Ethidium Bromide must be disposed as hazardous waste in the labelled container in the fume hood.
Today you will run your M13KO7 digested samples on an agarose gel, cut the linearized backbone out of your gel and then purify the DNA from the agarose. Next time you will mix the backbone and insert in a ligation reaction.
Protocols
Part 1: Running your gel
- Add 2.5 µl loading dye to M13KO7 samples from last time. Loading dye contains xylene cyanol as a tracking dye to follow the progress of the electrophoresis (so you don’t run the smallest fragments off the end of your gel!) as well as glycerol to help the samples sink into the well.
- Flick the eppendorf tubes to mix the contents then quick spin them in the microfuge to bring the contents of the tubes to the bottom.
- Load the gel in the order shown in the table below. One group will load in wells 1 through 3, another group will load in wells 5 through 7. To load your samples, draw 25 µl into the tip of your P200. Lower the tip below the surface of the buffer and directly over the well. You risk puncturing the bottom of the well if you lower the tip too far into the well itself (puncturing well = bad!). Expel your sample into the well. Do not release the pipet plunger until after you have removed the tip from the gel box (or you’ll draw your sample back into the tip!).
- Once all the samples have been loaded, attach the gel box to the power supply and run the gel at 125V for no more than 45 minutes.
- You will be shown how to photograph your gel and excise the relevant bands of DNA.
| LANES | SAMPLES | VOLUMES TO LOAD |
|---|---|---|
| 1 | 1 kb Marker | 5 µl |
| 2 | M13KO7 Uncut Sample | All of Reaction Volume (~30µl) |
| 3 | M13KO7 digested sample | All of reaction volume (~30µl) |
| 4 | Empty | |
| 5 | 1 kb Marker | 5 µl |
| 6 | M13KO7 Uncut Sample | All of Reaction Volume (~30µl) |
| 7 | M13KO7 digested sample | All of reaction volume (~30µl) |
| 8 | Empty | |
| 9 | Empty | |
| 10 | Empty |
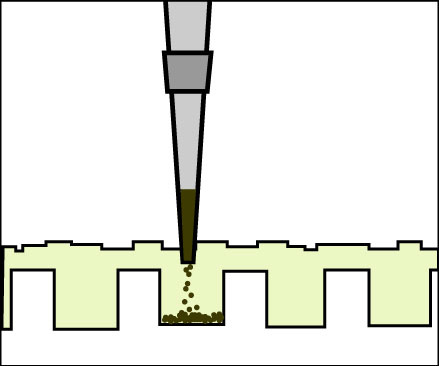
Loading a gel. (Figure by MIT OpenCourseWare.)
Part 2: Isolating/Purifying DNA
To purify your DNA from the agarose, you will use a kit sold by Qiagen. The reagents have uninformative names and their contents are proprietary. The Agarose Purification kit requires binding the DNA to a spin-column with a silica-gel membrane, washing away salts and eluting the DNA from the membrane.
- Add 550 µl of QG to your slice of agarose.
- Incubate at 50°C for 10 minutes until the agarose is completely dissolved. Every few minutes, you can remove your tube from the 50°C heat to flick the contents. This will help dissolve the agarose.
- Add 125 µl of isopropanol to your eppendorf tube.
- Get a QIAquick spin column (purple) with collection tube (clear) from the teaching faculty. Label the spin column (not the collection tube!) then pipet the dissolved agarose mixture in the top of the column. Microfuge the column in the collection tube for 60 seconds. The maximum capacity of the QIAquick columns is 800 µl! If you have more than 800 µl in your mixture, you will need to repeat this step.
- Discard the flow-through in the sink and replace the spin-column in its collection tube. Add 750 µl of PE to the top of the column and spin as before.
- Discard the flow-through in the sink and replace the spin-column in the collection tube. Add nothing to the top but spin for 60 seconds more to dry the membrane.
- Trim the cap off a new eppendorf tube and label the side with your team color and the date. Place the spin-column in the trimmed eppendorf tube and add 30 µl of EB to the center of the membrane.
- Allow the column to sit at room temperature for one minute and then spin as before. The material that collects in the bottom of the eppendorf tube is your purified plasmid backbone, ready to be ligated. Give it to the teaching faculty who will store it with your insert until next time.
Part 3: Titering Phage
One technique you will see several times this term is plating for plaques. The idea of this technique is simple. Since phage infection slows down the growth of bacteria, any phage-infected cell will grow less quickly than an uninfected one, giving rise to a zone that is more clear on a lawn of fully grown cells. This zone is called a plaque and by counting the number of plaques formed, it is possible to measure the number of infective phage in the sample you are testing. The number of infected phages is measured as PFUs, which is “plaque forming units per ml.”
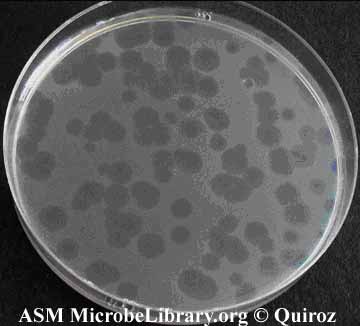
Plaques formed by bacteriophage upon infection of susceptible bacteria. Source: Assorted Views of Bacteriophage Plaques. © Quiroz. Licensed for use, ASM MicrobeLibrary.
- Start by placing 6 LB plates in the 37° incubator to prewarm them. If there is any condensation on the surface of the plates, then you can leave the lids slightly ajar to dry the plate surface.
- Aliquot 200 µl of bacteria into 6 small, sterile test tubes. The bacteria you are using are the strain ER2267 since this strain has a selectible F’. Label the tops of each tube with a colored sticker and one of the following: none, none, 10-4 E4, 10-6 E4, 10-4 K07, 10-6 K07.
- The teaching faculty have two phage stocks for you to compare, an M13KO7 phage stock and a stock of another M13 phage called E4. You will need to serially dilute each stock, making stepwise 1/100 dilutions in eppendorf tubes. For example, add 10 µl of a phage stock to 990 µl sterile water for a 10-2 dilution, then repeat, using 10 µl of the 10-2 dilution into 990 µl sterile water to make a 10-4 dilution. Vortex the dilutions before removing any liquid and change pipet tips to prepare each new dilution. Continue serially diluting the phage to final concentrations that are 10-4th and 10-6th as concentrated as the starting stock.
- Mix 10 µl of one of the 10-4 dilutions into a tube with bacteria.
- Mix 10 µl of one of the 10-6 dilution into another tube with bacteria.
- Repeat with the dilutions of the other phage stock.
- One of the teaching faculty will show you how to mix 3 ml of top agar into one of the uninfected samples you have prepared and how to pour the molten mix onto the surface of a prewarmed LB plate.
- You and your partner should add top agar to the other uninfected sample and the four phage infected ones.
Allow the top agar to solidify by leaving the plates on the bench at least 5 minutes then stack them and wrap them with your colored tape and finally move them to the 37° incubator to grow overnight. One of the teaching faculty will remove them from the incubator tomorrow and store them for you until next time.
DONE!
For Next Time
- Take the log10 of the length of each molecular weight marker you can identify on your agarose gel photograph. Graph the log10 of their length on the y-axis versus the distance they migrated from the well on the x-axis, measured in mm using a ruler and the picture of your agarose gel. An example of such a graph is found in the introduction to today’s experiment. Use the equation of the line from your graph to determine the size of your M13KO7 backbone (use the band in the lane in which you loaded the cut DNA). How does this measurement compare with the predicted size?
- How many plaques do you expect if you plated 10 µl of a 10-8 dilution of phage, if the titer of phage was 1012th plaque forming units/ml? How many plaques would you expect if you tested the phage stock on strain DH5?
- The oligonucleotide you are adding to p3 uses traditional genetic engineering (“recombinant”) techniques. These are powerful and precise ways to move single genes from one organism to another and to make useful chimeric protein products like the one you are now working on. Synthetic biology is a newer approach to programming cells. Please read one (or more!) of the following articles and then write a paragraph exploring the legitimacy of the following statement: “synthetic biology is about engineering while genetic engineering is about biology.”
- Tucker, Jonathan B., and Raymond A. Zilinskas. “The Promise and Perils of Synthetic Biology.” (PDF) New Atlantis, Spring 2006.
- Stone, Marcia. “Life Redesigned to Suit the Engineering Crowd.” (PDF) Microbe, Fall 2006.
- Marguet, P., et al. “Biology by Design: Reduction and Synthesis of Cellular Components and Behaviour.” Journal of the Royal Society Interface 4 no. 15 (August 22, 2007): 607-623. (PDF)
Reagents list
- Loading Dye
- 0.25% xylene cyanol
- 30% glycerol
- RNase
- 1% agarose gel in 1X TAE
- 1X TAE
- 40 mM Tris-acetate
- 1 mM EDTA
- pH 8.3
- 1 kb Marker
- T4 DNA Ligase Buffer (1X)
- 50 mM Tris-HCl
- 10 mM MgCl2
- 10 mM DTT
- 1 mM ATP
- 25 μg/ml BSA


