Tutorial 3. Machine Learning
tutor3.jpg
Description:
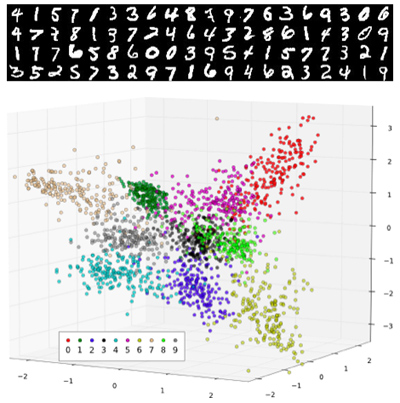
Visualization of the results of principal components analysis applied to high-dimensional data capturing visual properties of handwritten digits. The data was reduced to three dimensions that capture most of the variation in the original data, roughly segregating the data into the corresponding digits, as portrayed by the different colors of the data points.
file
93 kB
tutor3.jpg
Alt text:
An array of handwritten digits accompanied by a 3-D scatter plot.
Caption:
Visualization of the results of principal components analysis applied to high-dimensional data capturing visual properties of handwritten digits. The data was reduced to three dimensions that capture most of the variation in the original data, roughly segregating the data into the corresponding digits, as portrayed by the different colors of the data points.

Course Info
Instructors
Departments
As Taught In
Summer
2015
Level
Topics
Learning Resource Types
theaters
Other Video
theaters
Lecture Videos
notes
Lecture Notes
group_work
Projects
Instructor Insights


