
Homework 4. For \(r\) varying between 0 and 4, find out the possible “limit cycles"§ of the iterative map:
\begin{equation} x_{n+1}=r x_n(1-x), \qquad x_0= 0.5 \text{(or anything else that is not $0$ nor $1$)} \end{equation}
This converges to a single value for some values of \(r\) but for others results in an “orbit”, which can be very long. For every \(0<r<4\), “find” this orbit and plot the orbits together.
Use the “matrix-at-a-time” notation we learned in the last iteration example:
- Start with a vector of \(r-\)values, and a vector of \(x-\)values (both row vectors and the same size).
- Perform many (how many?) iterations on the whole vector of \(x-\)values, so that each place in the vector is updated according to its appropriate \(r\).
- Plot the resulting \(x\)-values vs. the \(r\) values.
- Continue the iteration and plot several more iterations (how many?).
- Observe the nice pattern that arises, and explore its self-similarity properties.
Hint 1: (Am I getting the right answer?) The result should look something like this:
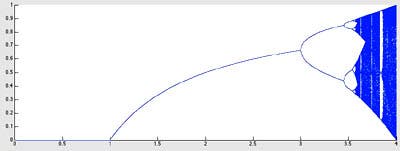
Graphing an iterative function.
Hint 2: (Code takes forever) If your code is running very slowly, you should consider updating all the orbits (one for each \(r\) value) at once. This implies holding a vector that corresponds to the \(r\) values you are considering, and a vector corresponding to the various orbits, and with one line of code you can update all the values in the orbit. Do this in a loop to find “late” elements of the orbit.
Hint 3: (Getting a similar plot, but not quite) You should only plot the late elements, so perhaps iterate without plotting for some time (maybe 1000 iterations?) and then plot successive elements of the orbit (say 100?).
Hint 4: (I don’t have so many points in my plot) Be sure to use hold on so that each plot doesn’t erase the previous ones.
More ideas:
- Find how to make the plot have small dots as markers.
- Can you allow the user to “zoom in” on your plot? Once asked to see a region smaller than \((0, 4)\times(0, 1)\) you should probably increase the “density” of your \(r\) measurements, and confine the plotting of the points so that only the requested \(x\)’s are plotted.
§a limit cycle is an orbit of an iterative map that the dynamics of the problem converges to, regardless of the initial condition.


